A volumetric 3-D digital analysis of dimensional changes to the alveolar process at implants placed immediately into extraction sockets
October 2, 2015 / Categories: Digital Dentistry, Implant Dentistry

Szathvary, Isacco

Caneva, Marco

Caneva, Martina

Bressan, Eriberto

Botticelli, Daniele
Meneghello, Roberto
The objective of this study was to validate the use of a novel method to elaborate 3-D data on dimensional changes to the alveolar process after one year of healing at implants placed immediately into extraction sockets.
Introduction
A recent systematic review of the literature regarding dimensional changes to the hard and soft tissue after tooth extraction was evaluated.1Tan WL, Wong TL, Wong MC, Lang NP. A systematic review of postextractional alveolar hard and soft tissue dimensional changes in humans. → Clin Oral Implants Res. 2012 Feb;23 Suppl 5:1–21. A vertical hard-tissue loss of 11–22% after six months of healing was found.
When the combined hard- and soft-tissue dimensional changes were considered, a variation of +0.1 to -0.9 mm after six months and of +0.4 to -0.8 mm after 12 months was found. A horizontal dimensional reduction of the hard tissue of between 29% and 63% was observed six to seven months after tooth extraction. When the combined hard- and soft-tissue dimensional changes were considered, a loss of 1.3 mm after three months and of 5.1 mm after 12 months was found. Moreover, the reduction was more rapid during the first three to six months, followed by a minor gradual reduction in dimensions thereafter.
In that review, the methods of measurement of the dimensional variation between the time of extraction and the subsequent period of reanalysis were also reported. For the hard tissue, radiographs, computed tomography scans, cone beam computed tomography scans, or reentry surgical procedures that included stents or other references were used for the analysis of the dimensional changes. For the combined hard- and soft-tissue dimensional changes, the casts mainly were analyzed.
Dimensional changes to the alveolar process may be analyzed using digitalized images (meshes) obtained by various 3-D digital methods: on casts, using laser scanners and structured- light 3-D scanners,2Cerardi A. Caratterizzazione meccanica, geometrica e funzionale di dispositivi biomedicali [doctoral thesis]. → [Padua]: University of Padua; 2010 [cited 2015 Jul 16]. 199 p. Available from: http://paduaresearch. cab.unipd.it/2833/. or chairside using 3-D intra-oral photogrammetric systems.3Windisch SI, Jung RE, Sailer I, Studer SP, Ender A, Hämmerle CH. A new optical method to evaluate threedimensional volume changes of alveolar contours: a methodological in vitro study. → Clin Oral Implants Res. 2007 Oct;18(5):545–51. The reproducibility of these methods has been shown to be high and their use for analyzing dimensional variations of the alveolar process has been recommended.4Strebel J, Ender A, Paqué F, Krähenmann M, Attin T, Schmidlin PR. In vivo validation of a threedimensional optical method to document volumetric soft tissue changes of the interdental papilla. → J Periodontol. 2009 Jan;80(1):56–61.5Thoma DS, Jung RE, Schneider D, Cochran DL, Ender A, Jones AA, Görlach C, Uebersax L, Graf-Hausner U, Hämmerle CH. Soft tissue volume augmentation by the use of collagenbased matrices: a volumetric analysis. → J Clin Periodontol. 2010 Jul;37(7):659–66.6Lehmann KM, Kasaj A, Ross A, Kämmerer PW, Wagner W, Scheller H. A new method for volumetric evaluation of gingival recessions: a feasibility study. → J Periodontol. 2012 Jan;83(1):50–4. Many of the recent studies that have used 3-D systems to analyze dimensional variations of the alveolar process, however, lost substantial information in transforming 3-D data to 2-D measurements.7Vanhoutte V, Rompen E, Lecloux G, Rues S, Schmitter M, Lambert F. A methodological approach to assessing alveolar ridge preservation procedures in humans: soft tissue profile. → Clin Oral Implants Res. 2014 Mar;25(3):304–9.8Schneider D, Schmidlin PR, Philipp A, Annen BM, Ronay V, Hämmerle CH, Attin T, Jung RE. Labial soft tissue volume evaluation of different techniques for ridge preservation after tooth extraction: a randomized controlled clinical trial. → J Clin Periodontol. 2014 Jun;41(6):612–7.Volumetric data instead were reported in a clinical study in which augmentation procedures were used at implants placed in edentulous ridges reduced in volume.9Friberg B, Jemt T. Soft tissue augmentation in connection to dental implant treatment using a synthetic, porous material—a case series with a 6-month follow-up. → Clin Implant Dent Relat Res. 2012 Dec;14(6):872–81. In the study, a grid was superimposed on the images so that both the global difference in volume before and after treatment and the differences in specific areas were reported. 2-D variations of the hard tissue around implants placed immediately into extraction sockets have been reported in clinical studies, 10Botticelli D, Berglundh T, Lindhe J. Hard-tissue alterations following immediate implant placement in extraction sites. → J Clin Periodontol. 2004 Oct;31(10):820–8.11Sanz M, Cecchinato D, Ferrus J, Pjetursson EB, Lang NP, Lindhe J. A prospective, randomized-controlled clinical trial to evaluate bone preservation using implants with different geometry placed into extraction sockets in the maxilla. → Clin Oral Implants Res. 2010 Jan;21(1):13–21. and, in an animal study, combined hard- and soft-tissue 2-D changes have been analyzed.12Caneva M, Botticelli D, Morelli F, Cesaretti G, Beolchini M, Lang NP. Alveolar process preservation at implants installed immediately into extraction sockets using deproteinized bovine bone mineral— an experimental study in dogs. → Clin Oral Implants Res. 2012 Jul;23(7):789–96. However, there is a lack of studies that report volumetric data on combined hardand soft-tissue variation at implants placed immediately into extraction sockets in humans using a 3-D system. Hence, the aim of the present study was to validate the use of a novel method to elaborate 3-D data on dimensional changes to the alveolar process after one year of follow-up at implants placed immediately into extraction sockets.
Materials & methods
The research protocol was approved by the ethics committee of Azienda Ospedaliera di Padova, Department of Neurosciences, University of Padua (protocol #2629P; 10 April 2012).
Patient selection
In order to be recruited for the study, the patients had to meet the following inclusion criteria: willing to participate for the duration of the study and to provide informed consent, at least 18 years of age, in good general health, presence of a tooth to be extracted, willing to accept the immediate placement of an implant into the extraction socket, and presence of adjacent teeth both mesially and distally. The following exclusion criteria were adopted: pregnancy or untreated dental disease. Smoking status was recorded, but was not considered a contraindication to treatment. Patients were advised that smoking is associated with an increased risk of implant failure.
Ten consecutive subjects were recruited. Written consent was obtained from the patients. All patients received a careful dental and periodontal examination, followed by oral hygiene instructions and dental and periodontal treatment, when necessary. All treatments and follow- ups were carried out in one clinic in Italy between September 2012 and September 2014. An impression using polyvinyl siloxane (Sky Putty and Sky Light, Sweden & Martina, Due Carrare, Italy) was taken before tooth extraction (Time 0 = T0) and a gypsum cast was obtained (ORTOTYPO 4, LASCOD, Sesto Fiorentino, Italy).
-
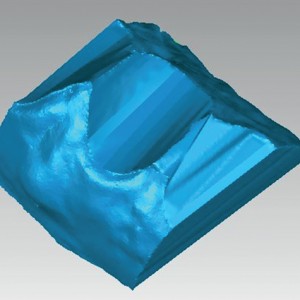
- Fig. 1
-
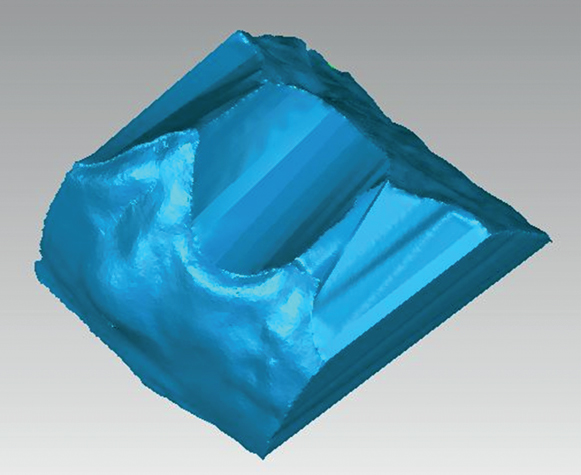
- Fig. 2
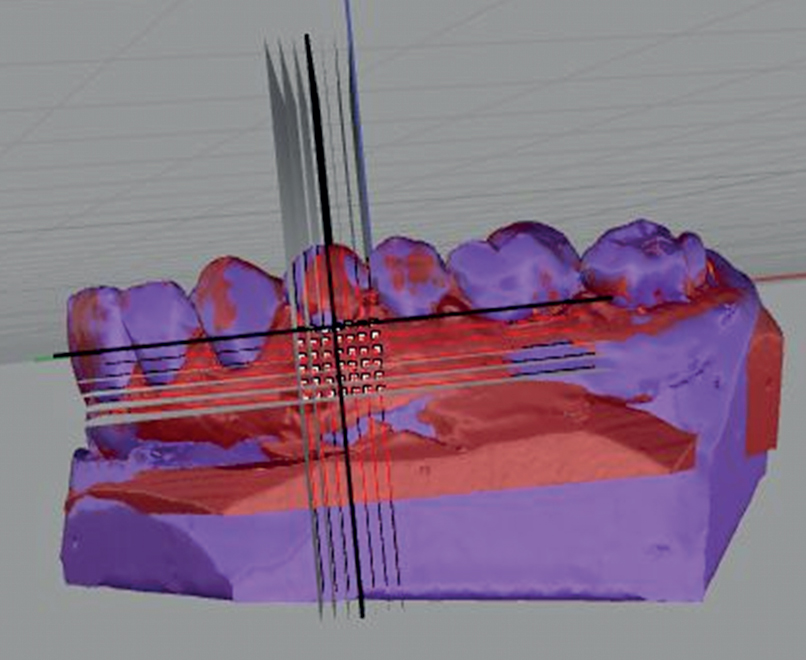
The two meshes (red T0 and purple T1) superimposed together were cut seven times vertically and six times horizontally using a Python script for Rhinoceros.
-
- FIg. 3
-
- Fig. 4
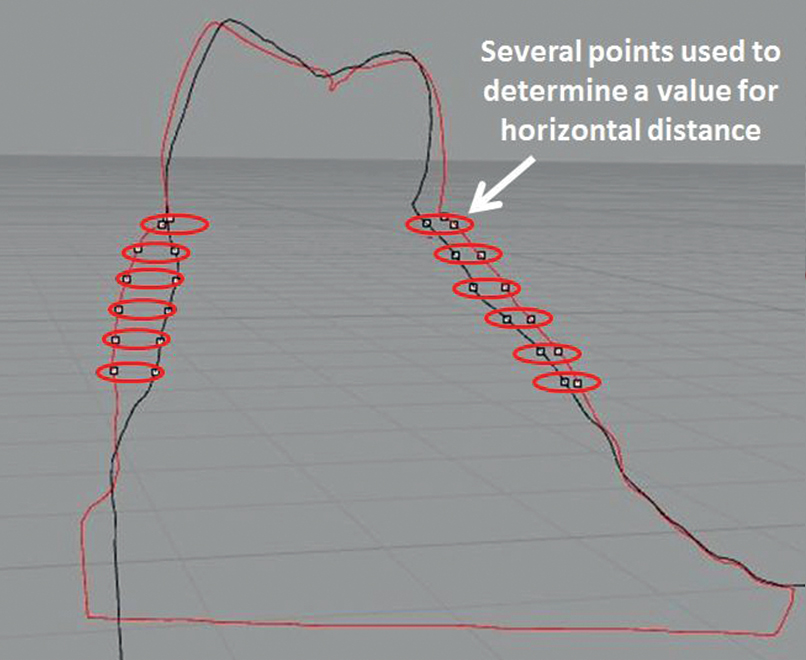
A vertical 2-D cut was taken in the middle. In red is the section of the first mesh (T0) and in black the second mesh at (T1). The distance between two points was taken for the measurements in absolute values.
Fig. 4
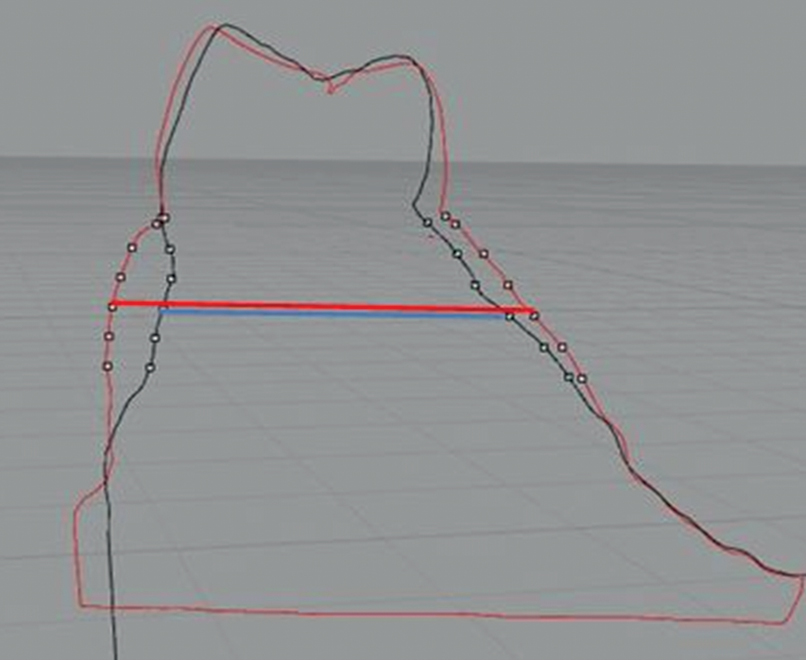
The width of the alveolar process was also measured. The red line represents the width at T0 and the blue line at T1.
Subsequently, local anesthesia was administered and the tooth was extracted. An implant was immediately placed into the extraction socket and no filler material or membrane was used. Implants with a ZirTi surface (Premium TG, Sweden & Martina, Due Carrare, Italy) were placed. A cover screw was placed on top of the implant and resorbable sutures were provided. No temporary prosthesis was seated. Antibiotics (amoxicillin 875 mg and clavulanic acid 125 mg b.i.d. for six days) and analgesics if needed were prescribed and the patients were enrolled in a maintenance follow-up. A porcelain-fused-tometal crown was provided to the patients approximately three months after placement. Another impression was taken 12 months after implant placement (Time 1 = T1).
2-D digital analysis
The casts obtained from the first and second impressions were digitalized using a 3-D laser scanner (Dental Wings 7Series, Montreal, Canada). The meshes (digital models) generated in this manner were imported into 3-D elaborating mesh software (Geomagic Studio and Geomagic Qualify, Geomagic, Berlin, Germany) and cleaned of defects.
The meshes were transformed from a surface to a solid. Subsequently, teeth surfaces that coincided on the meshes obtained from both casts were selected and the two digital models were superimposed, accepting values of average convergence distance of < 0.1 mm.
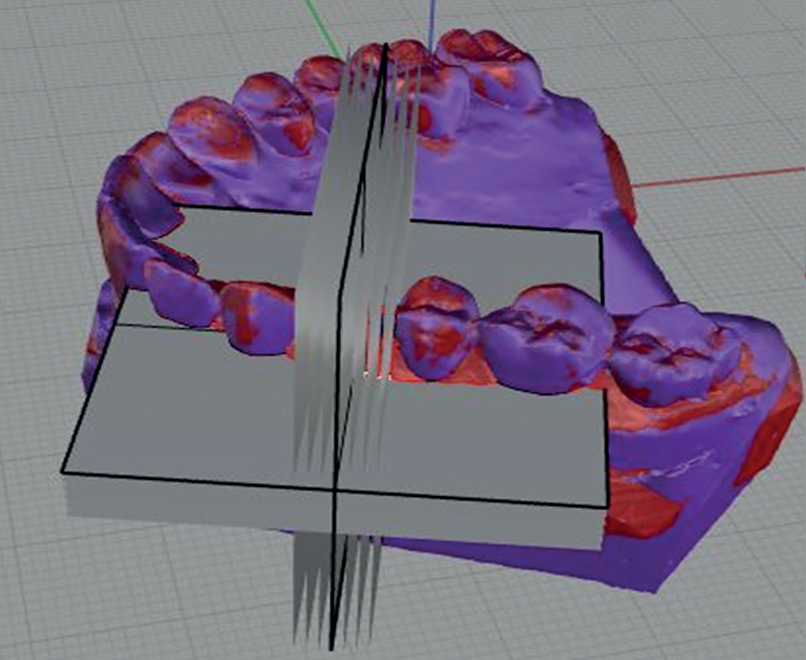
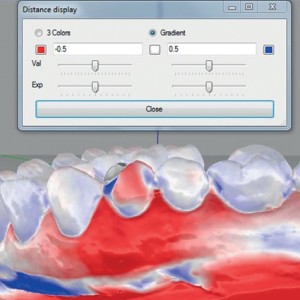
The 2-D analysis was performed using the occlusal plane as the reference plane.13Vanhoutte V, Rompen E, Lecloux G, Rues S, Schmitter M, Lambert F. A methodological approach to assessing alveolar ridge preservation procedures in humans: soft tissue profile. → Clin Oral Implants Res. 2014 Mar;25(3):304–9. From this reference, a perpendicular plane in the lingual– or palatal–vestibular direction (crosssection) was created and the two meshes superimposed were cut (Figs. 1 & 2). The grid used to section the meshes was made by taking the middle point of the vestibular marginal gingiva of the tooth to be extracted as the reference point (0) and creating vertical and horizontal planes starting from that point:
-
- Fig. 5
-
- Fig. 6
-
- Fig. 7
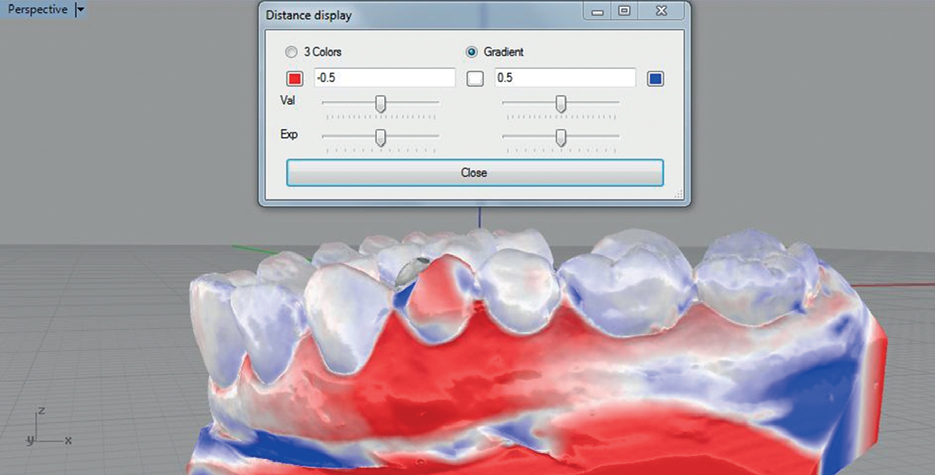
The mesh-to-mesh deviation utility in Rhino Open Projects. The red area represents the volume loss. The area most affected by resorption corresponds to about the vertical middle line of the two adjacent teeth.
Fig. 6
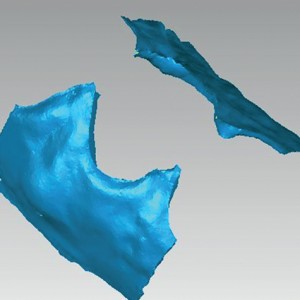
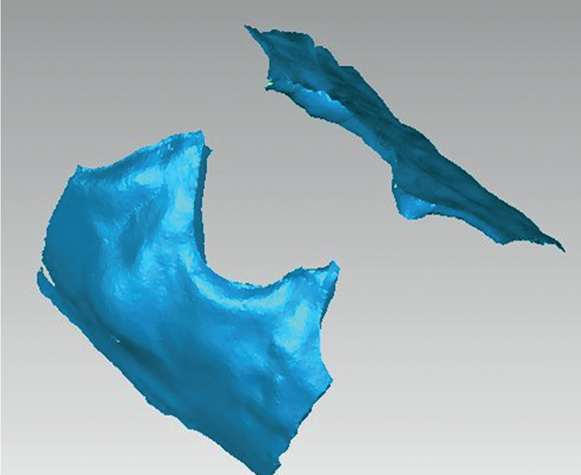
Palatal and buccal volumes, isolated from the rest of the model during 3-D elaboration. They represent the volume loss in the ROI and can be measured as absolute values in mm³.
Fig. 7
ROI volume of the first mesh, which represents the volume of the alveolar process at T0, expressed in mm³.
Vertically: Seven vertical planes located at +3, +2, +1, 0, -1, -2 and -3 mm from the mesial (+3) to the distal aspect (-3);
Horizontally: Six horizontal planes at 0 (vestibular marginal gingiva), -1, -2, -3, -4 and -5 mm from the most coronal (0) to the most apical (-5).
The occlusal plane, the cutting procedure and the distance analysis were performed with automated Python scripts for Rhinoceros software (Robert McNeel & Associates, Seattle, Wash., U.S.) to reduce human error during elaboration. A total of 42 points for horizontal variation for each side was tested: 42 at the buccal aspect and 42 at the lingual/ palatal aspect. The vertical variation was measured at seven points at the buccal aspect and seven points at the lingual/palatal aspect. Using the measures of the alveolar process at T0 and at T1, the dimensional variations (Δ) were expressed in absolute (Fig. 3)and relative (Fig. 4) values (in respect of the total alveolar width).
3-D digital analysis
The 3-D analysis was performed by subtracting the volume of the second mesh (T1) from that of the first mesh (T0), generating a resulting volume that represented the difference between the two meshes (Boolean difference). Consequently, the software automatically defined the limits of the volume loss. The region of interest (ROI) was manually delimited mesially and distally using as limits a plane crossing through the middle of the crown of the two adjacent teeth. The limits of the ROI were decided on because the main volume changes were included in that region, as indicated by the mesh-to-mesh deviation (Δ; Fig. 5) performed with the Rhino Open Projects for Rhinoceros plug-in.
Using the Geomagic software, the two meshes (T0 and T1) were further cleaned of the teeth and of apical imperfections derived from the technical procedures applied to obtain the casts. Finally, the delimited areas were elaborated by closing the holes and obtaining a solid that represented the buccal and lingual/palatal volume changes (Fig. 6). The file containing the data on the solid was exported in STL format and imported into Rhinoceros for volumetric analysis.
In order to obtain standardized data, the solid was further elaborated using the Geomagic software. Only the outer surfaces were maintained, while the rest of the solid was eliminated.
The two outer surfaces were combined together with bridges and, after closing the gaps (between bridges), another solid was generated that represented the global volume of the alveolar process delimited into the ROI (V-ROI; Fig. 7) before volume changes (i.e., at T0). Similar procedures were applied to the corresponding contralateral control site to obtain volume changes between T0 and T1.
Volumetric analysis
The average convergence distance represents the misfit between the two meshes. The differences in volume (Δ) between the meshes of the two periods at the extraction sites were calculated as total amount (V-tot), as well as for the buccal (V-b) and lingual/palatal (V-l) aspects separately, and expressed in mm3. In order to reduce the variability associated with the use of absolute measurements in mm³ due to the dimensional variability of patients’ arches, the relative percentage of loss was also calculated in relation to the V-ROI at T0. Percentages of the total amount (V-tot%) and of the buccal (V-b%) and lingual/palatal (V-l%) aspects were obtained.
At the control sites, the same methodology for measurements was applied for both absolute and relative (percentage) values, and the results were used to define the global errors of the procedure due to the Boolean method, superimposition, impression taking, gypsum casting and 3-D scanning.
Data analysis
Mean values and standard deviations were calculated for the 2-D data, while mean values and standard deviations, as well as the 25th, 50th (median) and 75th percentiles, were calculated for the 3-D data. Differences in the volumetric variation (Δ) between the implant and the contralateral sites were analyzed using the Wilcoxon signed-rank test. The level of significance was set at α = 0.05. In case of normal distribution, a t-test was also performed.
Results 2-D analysis At the buccal aspect (Table 1), a tendency to higher horizontal resorption of the alveolar process was seen in the central regions where tooth extraction was performed compared with the mesial and distal regions. Moreover, the resorption had a tendency to be higher at the coronal aspects compared with the apical. The horizontal resorption varied between 3% and 25%, depending on the interception point from which it was analyzed, the highest variation being in the central/coronal regions, and the lowest being at the mesiodistal/apical regions. Similar results were observed at the lingual/palatal aspect (Table 2) and in the global horizontal variation (Table 3).
The vertical resorption of the alveolar process analyzed on the seven vertical cutting planes was higher in the mesial and distal regions compared with the central regions at the buccal aspect. A tendency to higher resorption was seen in the central regions at the lingual/ palatal aspect (Table 4).
3-D analysis
When the absolute values were taken into account (Table 5), it was observed that the larger the ROI, the higher the volume loss, with a positive linear correlation between the two variables (R2 = 0.9346; y = 0.126x). The volume loss was 69.7 ± 39.1 mm3 and 74.3 ± 29.8 mm3 at the buccal and lingual/palatal aspects, respectively, and a global volume loss of 144.1 ± 61.2 mm³ was observed. The global volume loss in percentage was 12.7 ± 3.1%, showing a lower variability of the results between sites compared with the absolute values (Table 5). The loss was 5.9 ± 1.9% at the buccal and 6.8 ± 2.2% at the lingual/palatal aspects, the difference not being statistically significant. Small variations in volume at the control sites were also observed that represented the errors included in the 3-D analysis.
Discussion
2-D analysis
The 2-D analysis demonstrated a reduction of the dimensions at both the buccal and lingual/palatal aspects. However, the analysis of each intersection point and the comparison of all of the patients were very demanding. Moreover, the variability per intersection point was very large, making drawing conclusions using this method difficult. It is, of course, possible to select just one intersection point and compare it with the lingual/palatal aspect or with that of other patients. However, to perform a complete analysis of the phenomenon, 42 intersection points (such as those that composed the grid) were analyzed.
2-D analysis offers advantages for investigation of defect shape and for analysis of local defects. However, limits to consider include the use of 2-D numbers to express 3-D aspects, the lack of information about the size of the area affected by the resorption, and the huge amount of data that must be recorded and that require a great deal of time to analyze.
Moreover, great variability in resorption exists, depending on where the volume loss is investigated. In the present study, a horizontal mean global volume loss of 3.8–43.9% in the analyzed area made it impossible to summarize the phenomenon with a unique number that expresses the volume loss. For the vertical loss in the 2-D analysis, the results have to be reported in millimeters, since it does not seem to be appropriate to report data in percentages because of the lack of a reference dimension.
3-D analysis
The 3-D analysis showed that shrinkage of the volume of the alveolar process occurred at both the buccal and lingual/palatal aspects after tooth extraction and immediate placement of an implant in the extraction socket. A global volume loss of 12.7% was observed, being 5.9% at the buccal and 6.8% at the lingual/ palatal aspects. The difference was not statistically significant. These outcomes differ from those reported on 2-D variations of the alveolar process14Schropp L, Wenzel A, Kostopoulos L, Karring T. Bone healing and soft tissue contour changes following single-tooth extraction: a clinical and radiographic 12-month prospective study. → Int J Periodontics Restorative Dent. 2003 Aug;23(4):313–23. or of the bony crest.15Botticelli D, Berglundh T, Lindhe J. Hard-tissue alterations following immediate implant placement in extraction sites. → J Clin Periodontol. 2004 Oct;31(10):820–8.16Sanz M, Cecchinato D, Ferrus J, Pjetursson EB, Lang NP, Lindhe J. A prospective, randomized-controlled clinical trial to evaluate bone preservation using implants with different geometry placed into extraction sockets in the maxilla. → Clin Oral Implants Res. 2010 Jan;21(1):13–21. In those studies, however, a single reference point was used, while the global volume of the ROI was analyzed in the present study. Moreover, the studies on bony crest variation did not include measurements of soft-tissue dimensions. It has to be considered that the procedure used in the present study allowed for the use of 2-D data too regarding a single intersection point or single plane, and this may have permitted a more complete analysis.
| VP3 | VP2 | VP1 | VP0 | VP-1 | VP-2 | VP-3 | |
|---|---|---|---|---|---|---|---|
| HP 0 | -14.8 (7.1) | -17.5 (4.6) | -24.0 (24.0) | -16.8 (17.8) | -20.0 (15.9) | -18.0 (10.5) | -12.5 (5.7) |
| HP -1 | -12.7 (6.5) | -15.7 (7.0) | -17.6 (8.2) | -15.9 (7.5) | -15.7 (6.1) | -12.5 (3.3) | -9.5 (4.4) |
| HP -2 | -9.1 (5.6) | -11.0 (5.8) | -12.2 (5.1) | -11.9 (4.1) | -10.6 (3.4) | -9.2 (3.8) | -7.0 (3.6) |
| HP -3 | -6.7 (5.1) | -8.1 (5.5) | -8.8 (5.0) | -8.9 (4.7) | -8.3 (4.3) | -6.7 (3.7) | -5.0 (2.9) |
| HP -4 | -4.6 (4.7) | -5.7 (5.3) | -5.9 (5.0) | -5.6 (4.4) | -5.1 (3.7) | -4.1 (2.9) | -3.0 (2.3) |
| HP -5 | -2.6 (3.7) | -3.3 (4.3) | -3.6 (4.2) | -3.4 (4.2) | -3.1 (3.9) | -2.6 (3.1) | -2.0 (2.4) |
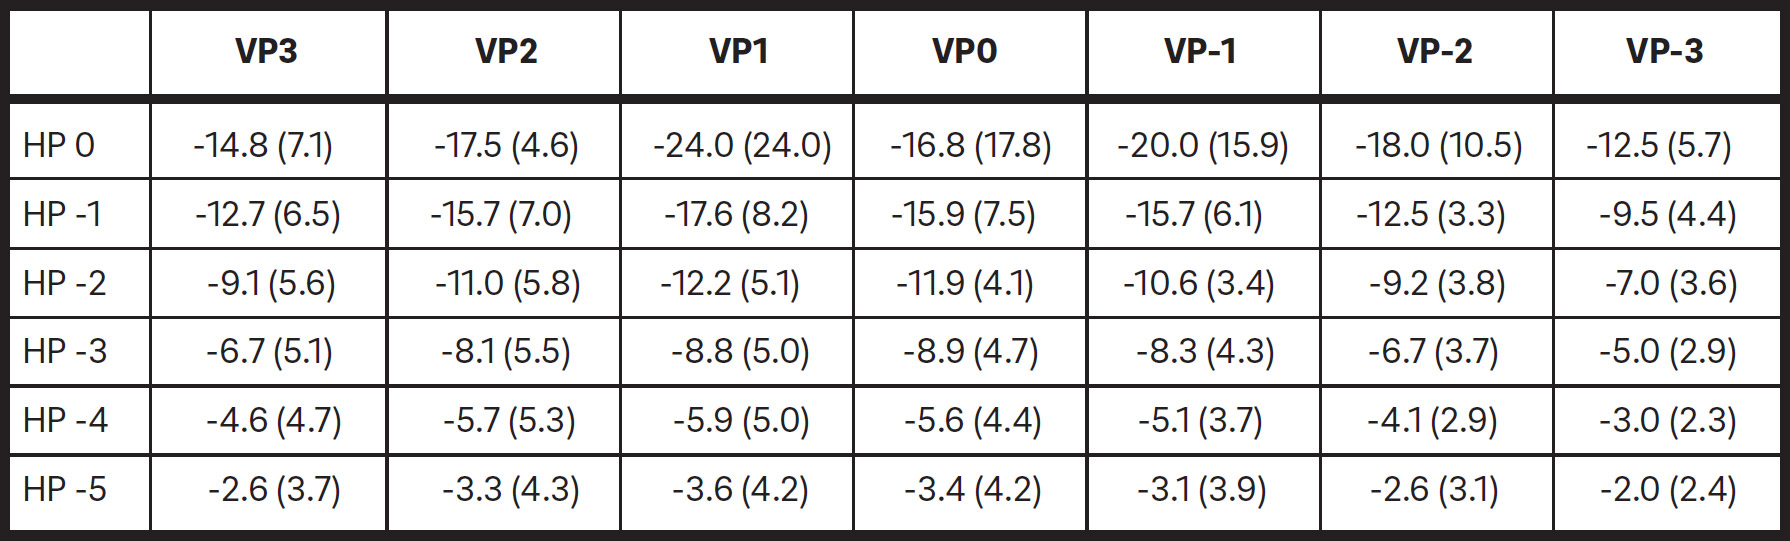
2-D analysis. Mean values and standard deviations of the horizontal reduction of the buccal aspect of the alveolar process at the 42 intersection points in %. HP = Horizontal plane; VP = Vertical plane.
| VP3 | VP2 | VP1 | VP0 | VP-1 | VP-2 | VP-3 | |
|---|---|---|---|---|---|---|---|
| HP 0 | -9.4 (3.9) | -14.7 (4.2) | -19.9 (7.8) | -24.1 (14.1) | -20.9 (8.4) | -19.7 (9.5) | -17.9 (13.6) |
| HP -1 | -7.6 (5.6) | -11.1 (5.6) | -14.6 (9.2) | -17.7 (12.7) | -15.4 (10.1) | -11.8 (6.6) | -8.5 (4.6) |
| HP -2 | -4.1 (3.1) | -6.0 (3.7) | -7.6 (4.6) | -8.7 (4.8) | -8.1 (4.5) | -6.8 (3.9) | -5.2 (3.0) |
| HP -3 | -2.7 (2.0) | -3.3 (2.3) | -4.3 (2.8) | -4.8 (2.7) | -4.6 (2.4) | -4.1 (2.1) | -3.5 (2.0) |
| HP -4 | -1.7 (1.4) | -2.0 (1.8) | -2.7 (2.0) | -2.9 (1.8) | -2.9 (1.8) | -2.8 (1.8) | -2.7 (1.7) |
| HP -5 | -1.2 (1.3) | -1.1 (1.4) | -1.5 (1.7) | -2.0 (1.9) | -2.2 (1.6) | -2.1 (1.5) | -2.1 (1.5) |
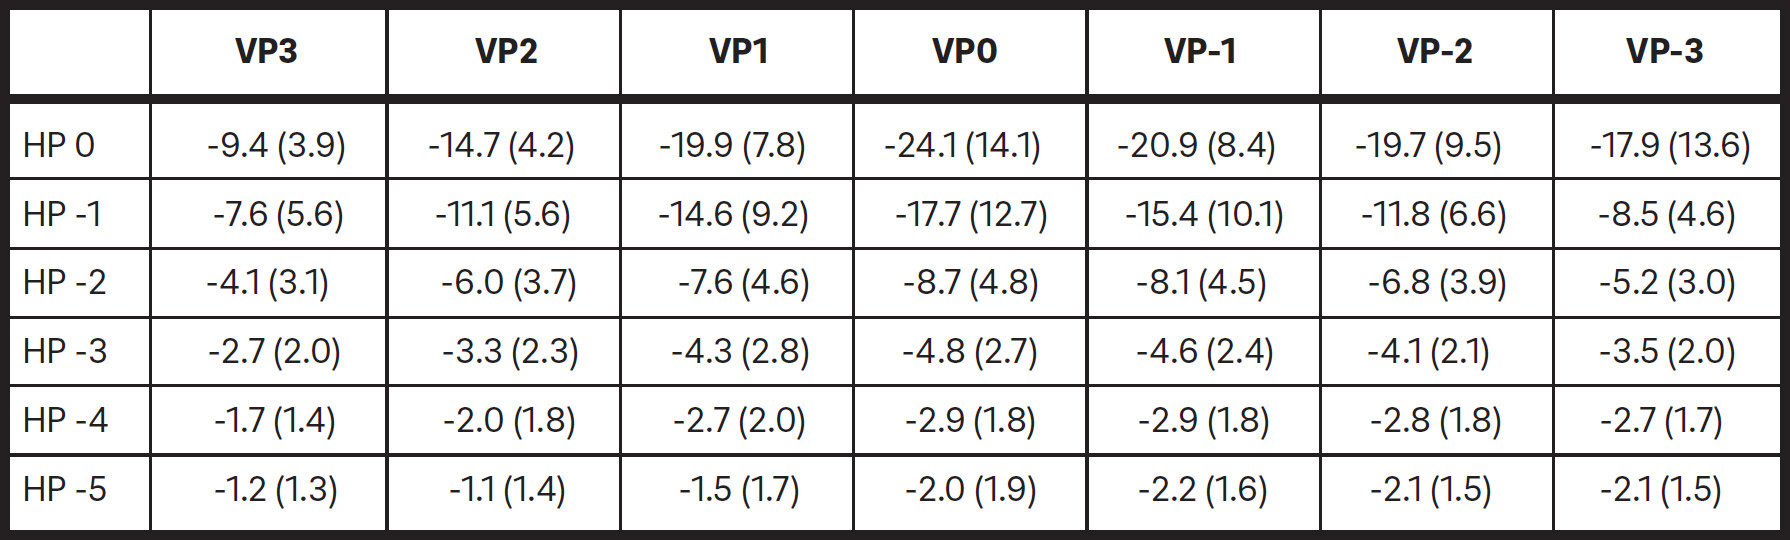
2-D analysis. Mean values and standard deviations of the horizontal reduction of the lingual/palatal aspect of the alveolar process at the 42 intersection points in %. HP = Horizontal plane; VP = Vertical plane.
| VP3 | VP2 | VP1 | VP0 | VP-1 | VP-2 | VP-3 | |
|---|---|---|---|---|---|---|---|
| HP 0 | -24.2 | -32.2 | -43.9 | -40.9 | -40.9 | -37.8 | -30.4 |
| HP -1 | -20.4 | -26.8 | -32.2 | -33.6 | -31.1 | -24.3 | -18.0 |
| HP -2 | -13.2 | -17.0 | -19.8 | -20.6 | -18.7 | -15.9 | -12.2 |
| HP -3 | -9.4 | -11.3 | -13.1 | -13.7 | -12.9 | -10.8 | -8.5 |
| HP -4 | -6.2 | -7.6 | -8.6 | -8.5 | -7.9 | -6.9 | -5.7 |
| HP -5 | -3.8 | -4.4 | -5.2 | -5.4 | -5.3 | -4.7 | -4.0 |
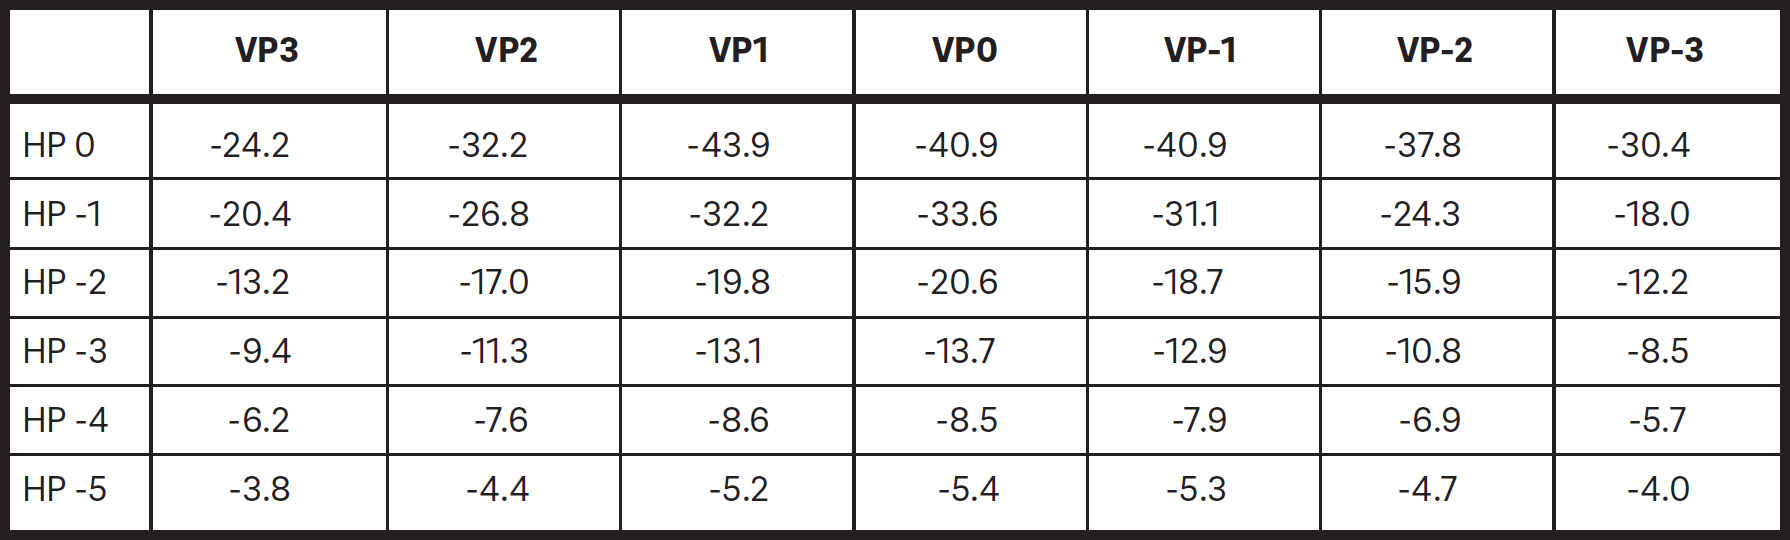
2-D analysis. Global horizontal reduction of the alveolar process in % represented by the sum of the mean values of the buccal and lingual/palatal reduction at the 42 intersection points. HP = Horizontal plane; VP = Vertical plane.
The 3-D method can be affected by various errors related to the impression, model fabrication, 3-D scanning (reverse engineering phase), mesh creation, 3-D elaboration and superimposition. In the present study, the dimensional variations between the two periods (T0 and T1) at the contralateral sites were also analyzed. Small variations were found, most likely due to the errors included in the method. The differences between the implant sites and the contralateral sites were highly statistically significant. This, in turn, meant that these errors did not affect the data that this 3-D method produced and the volume differences found were not due to the case or to errors, but to the biological phenomenon of resorption. In the present study, a positive linear correlation between the global volume of the ROI and the volume loss was found. This means that the larger the jaw, the larger the resorption.
This observation makes it senseless to investigate volume loss with a superimposed standardized grid for analysis. In fact, in the present study, a standardized grid was used with squares of 1 mm in dimension and not a grid that was adapted in dimensions to those of the alveolar process. It has to be considered that the distance between the two adjacent teeth is not the same in different locations and in different subjects, so the area covered by a standardized grid does not include the whole ROI. Moreover, the measures taken in each intersecting plane do not represent the same position in all patients. Consequently, the grid should be adapted to the dimension of the space between the two adjacent teeth. The use of 2-D analysis may be comparable if used in the middle of the ROI be cause it is a reference plane easily detected in all models.
| Vertical plane | Buccal aspect | Lingual/palatal aspect |
|---|---|---|
| 3 | -1.4 (0.6) | -1.1 (0.5) |
| 2 | -1.2 (0.4) | -1.2 (0.6) |
| 1 | -0.8 (0.5) | -1.5 (0.6) |
| 0 | -0.5 (0.7) | -1.3 (1.2) |
| -1 | -0.6 (0.9) | -1.5 (0.8) |
| -2 | -0.9 (0.6) | -1.1 (1.6) |
| -3 | -1.2 (1.0) | -1.0 (1.6) |
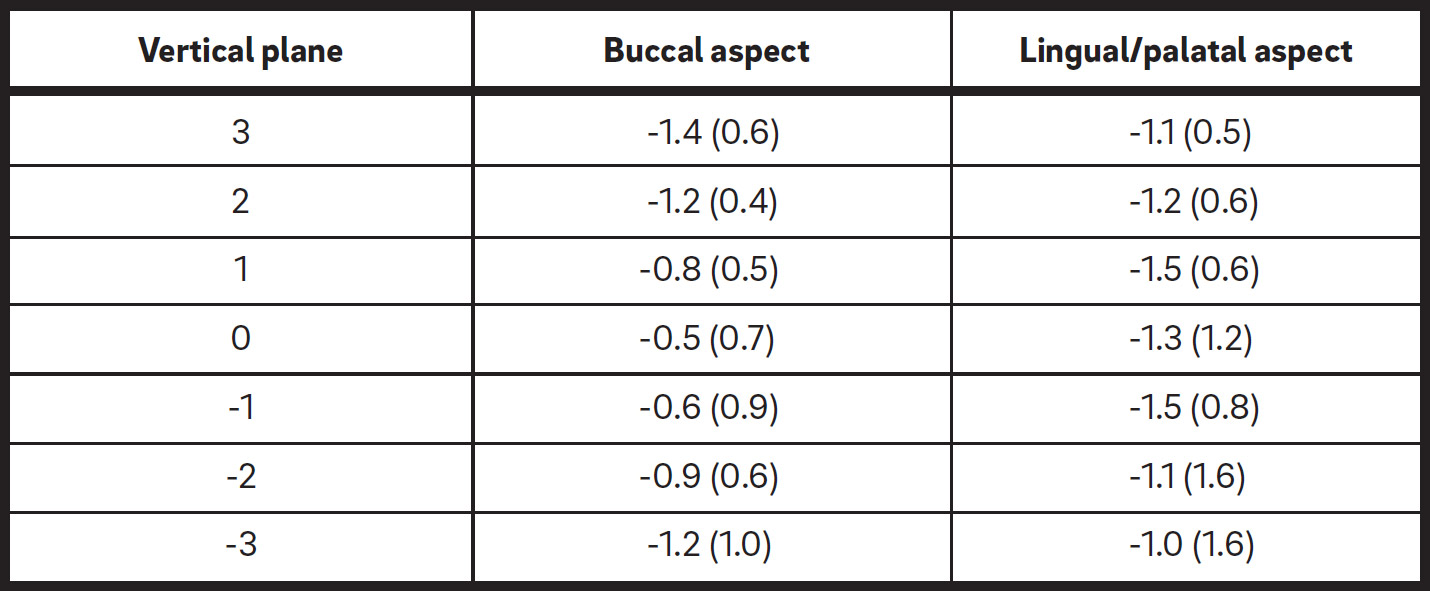
2-D analysis. Mean values and standard deviations of the vertical reduction of the buccal and lingual/palatal aspects of the alveolar process at the most coronal of the seven intersection points in mm.
| Δ V-b mm³ | Δ V-l mm³ | Δ V-tot mm³ | V-ROI mm³ | Δ V-b% | Δ V-l% | Δ V-tot% | ||
|---|---|---|---|---|---|---|---|---|
| Test implant site | Mean (S.D.) | 69.7 (39.1) | 74.3 (29.8) | 144.1 (61.2) | 1202.9 (524.4) | 5.9 (1.9) | 6.8 (2.2) | 12.7 (3.1) |
| Median (25th; 75th percentiles) |
63.8* (34.4; 105.4) |
75.5* (49.6; 88.8) |
134.3* (106.0; 174.5) |
1288.5 (895.3; 1557.8) |
6.4* (5.4; 7.1) |
6.7* (5.6; 8.3) |
12.9* (11.8; 13.4) |
|
| Contralateral control site |
Mean (S.D.) | 1.98 (1.74) | 1.98 (1.74) | 5.29 (5.24) | 1202.9 (524.4) | 0.18 (0.13) | 0.39 (0.42) | 0.57 (0.50) |
| Median (25th; 75th percentiles) |
1.73* (0.60; 3.31) |
2.67* (0.17; 3.61) |
4.02* (2.23; 7.11) |
1288.5 (895.3; 1557.8) |
0.19* (0.11; 0.26) |
0.20* (0.02; 0.77) |
0.45* (0.18; 0.98) |
*A p-value of < 0.05 between the test and control sites.
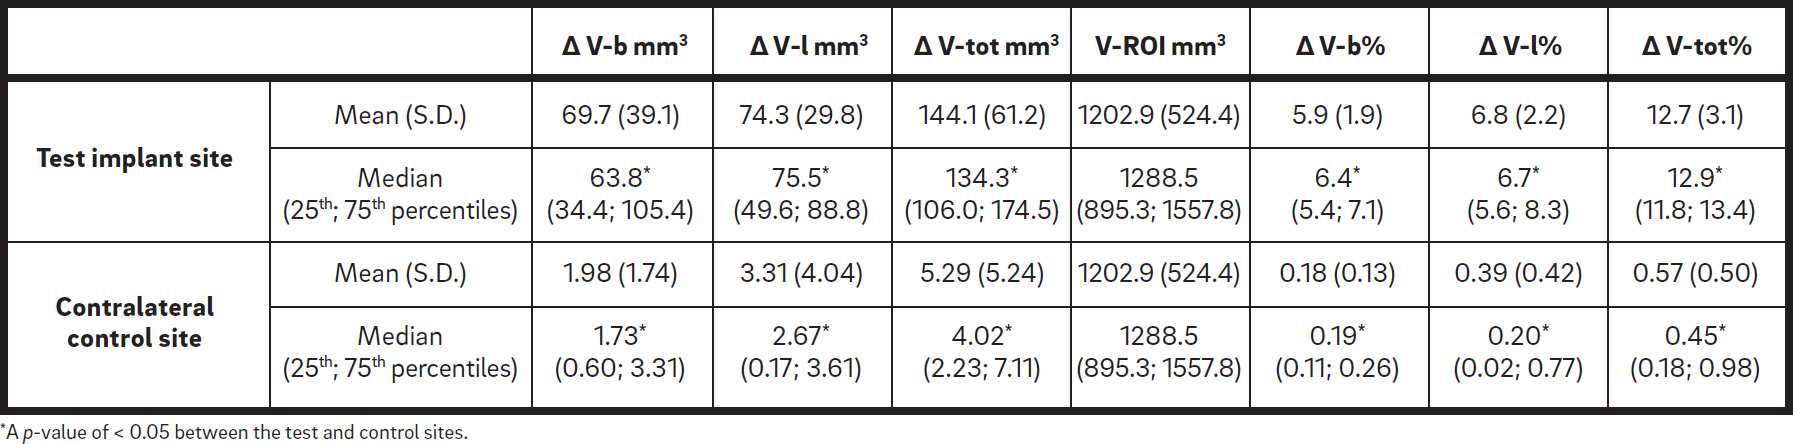
3-D analysis. Mean values, standard deviations (S.D.), medians, and 25th and 75th percentiles of the volume reduction of the alveolar process in absolute values in mmsup3; and in % at the test and control sites.
From a clinical perspective, the 3-D method may help clinicians to understand in a more objective manner what happens to the alveolar process after tooth extraction and the immediate placement of an implant. Differentiation between hard- and soft-tissue loss cannot be expressed by the data from this 3-D method and requires a different approach, such as surgical re-entry or radiographic assessment. The 3-D analysis used in the present study was found to be fast, accurate and noninvasive.
Conclusion
The 2-D method can be very useful for understanding changes at a localized point. The 3-D method proposed is faster, more accurate at expressing the volume loss and correlated to the dimensions of the analyzed region. The use of this method is consequently highly recommended.
Acknowledgments
The competent contributions of engineers Gianpaolo Savio, Matteo Turchetto and Andrea Cerardi in the automation of the 2-D processes of measurement are highly appreciated. Special thanks go to L.O.R.I. (Noventa Padovana, Italy) and Loripadova Tecnologia (Noventa Padovana) for support in the 3-D processing and to the Ariminum Research and Dental Education Center, Ariminum Odontologica, for data analysis and interpretation. The implants and impression material were provided by Sweden & Martina (Due Carrare, Italy).
References
| 1. | ↑ | Tan WL, Wong TL, Wong MC, Lang NP. A systematic review of postextractional alveolar hard and soft tissue dimensional changes in humans. → Clin Oral Implants Res. 2012 Feb;23 Suppl 5:1–21. |
| 2. | ↑ | Cerardi A. Caratterizzazione meccanica, geometrica e funzionale di dispositivi biomedicali [doctoral thesis]. → [Padua]: University of Padua; 2010 [cited 2015 Jul 16]. 199 p. Available from: http://paduaresearch. cab.unipd.it/2833/. |
| 3. | ↑ | Windisch SI, Jung RE, Sailer I, Studer SP, Ender A, Hämmerle CH. A new optical method to evaluate threedimensional volume changes of alveolar contours: a methodological in vitro study. → Clin Oral Implants Res. 2007 Oct;18(5):545–51. |
| 4. | ↑ | Strebel J, Ender A, Paqué F, Krähenmann M, Attin T, Schmidlin PR. In vivo validation of a threedimensional optical method to document volumetric soft tissue changes of the interdental papilla. → J Periodontol. 2009 Jan;80(1):56–61. |
| 5. | ↑ | Thoma DS, Jung RE, Schneider D, Cochran DL, Ender A, Jones AA, Görlach C, Uebersax L, Graf-Hausner U, Hämmerle CH. Soft tissue volume augmentation by the use of collagenbased matrices: a volumetric analysis. → J Clin Periodontol. 2010 Jul;37(7):659–66. |
| 6. | ↑ | Lehmann KM, Kasaj A, Ross A, Kämmerer PW, Wagner W, Scheller H. A new method for volumetric evaluation of gingival recessions: a feasibility study. → J Periodontol. 2012 Jan;83(1):50–4. |
| 7, 13. | ↑ | Vanhoutte V, Rompen E, Lecloux G, Rues S, Schmitter M, Lambert F. A methodological approach to assessing alveolar ridge preservation procedures in humans: soft tissue profile. → Clin Oral Implants Res. 2014 Mar;25(3):304–9. |
| 8. | ↑ | Schneider D, Schmidlin PR, Philipp A, Annen BM, Ronay V, Hämmerle CH, Attin T, Jung RE. Labial soft tissue volume evaluation of different techniques for ridge preservation after tooth extraction: a randomized controlled clinical trial. → J Clin Periodontol. 2014 Jun;41(6):612–7. |
| 9. | ↑ | Friberg B, Jemt T. Soft tissue augmentation in connection to dental implant treatment using a synthetic, porous material—a case series with a 6-month follow-up. → Clin Implant Dent Relat Res. 2012 Dec;14(6):872–81. |
| 10, 15. | ↑ | Botticelli D, Berglundh T, Lindhe J. Hard-tissue alterations following immediate implant placement in extraction sites. → J Clin Periodontol. 2004 Oct;31(10):820–8. |
| 11, 16. | ↑ | Sanz M, Cecchinato D, Ferrus J, Pjetursson EB, Lang NP, Lindhe J. A prospective, randomized-controlled clinical trial to evaluate bone preservation using implants with different geometry placed into extraction sockets in the maxilla. → Clin Oral Implants Res. 2010 Jan;21(1):13–21. |
| 12. | ↑ | Caneva M, Botticelli D, Morelli F, Cesaretti G, Beolchini M, Lang NP. Alveolar process preservation at implants installed immediately into extraction sockets using deproteinized bovine bone mineral— an experimental study in dogs. → Clin Oral Implants Res. 2012 Jul;23(7):789–96. |
| 14. | ↑ | Schropp L, Wenzel A, Kostopoulos L, Karring T. Bone healing and soft tissue contour changes following single-tooth extraction: a clinical and radiographic 12-month prospective study. → Int J Periodontics Restorative Dent. 2003 Aug;23(4):313–23. |


Leave a Reply
Be the First to Comment!